

Shopify is an e-commerce platform that allows anyone to create an online store and sell their products. It helps store owners manage marketing of their products, engaging with customers, and take control of their finances. It is one of the top ecommerce stores for independent businesses.
Shopify offers basic reports and analytics. These simple reports allow store owners to review their recent activity, get insight into their customers’ actions, analyze the speed of the online store, and analyze the store’s transactions. While Shopify’s analytics are a good place to start, it’s only the beginning. Take your e-commerce business-building strategy to the next level by using Google Analytics to create detailed reports quickly.
This in-depth guide will help you understand Shopify with Google Analytics and how to use it to improve your e-commerce business. You’ll also gather expert-level insight into Google Analytics and discover how to use Google Analytics to solve e-commerce challenges.
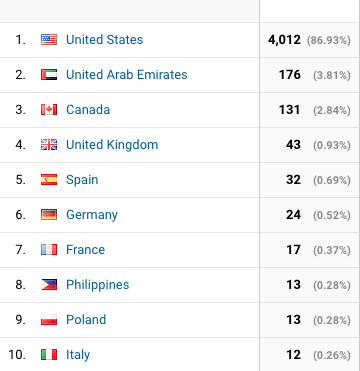
Table of Contents
What is Google Analytics and how can it help your Shopify store?
Google Analytics is a free web analytics service that is part of Google’s Marketing Platform. It is easy to install and can be integrated with any website. Google Analytics provides statistics and basic analytical tools to help improve your search engine optimization (SEO) and to provide feedback for marketing purposes. You can even monitor the activity in real-time.
Google Analytics has features that can help users see patterns and trends in how visitors engage with their website. These analytics can help you determine key metrics for your Shopify store. With Google Analytics, you can determine how customers use your Shopify store and for how long they browse your website. Then, you can interpret that data and use it to improve your business’s performance.
Google Analytics offers data collection, analysis, monitoring, visualization, reporting, and integration with other applications. These in-depth reports will give you a competitive edge over the basic analytics that Shopify offers. Shopify’s dashboard only provides prepackaged reports, which are not insightful enough to base major marketing decisions.
Google Analytics setup is quick and easy to set up through your Shopify admin page, particularly if you already have a Gmail account. When you combine Google Analytics with Shopify, you will have an edge over your competitors and solid business intelligence to guide you.
6 Google Analytics how-to’s to improve your Shopify experience
The most recent iteration of Google Analytics, GA4, was released in October 2020. GA4 offers a brand-new user interface and uses machine learning for improved accuracy. Other features of GA4 include Artificial Intelligence tools, customer-focused reporting centered around lifestyle data, improved Google Ads integration, integration with Google tag-manager, quicker load speed for your data, and enhanced data management capabilities.
There are many add-ons to Google Analytics that offer additional useful reporting. For example, it is easy to enable Enhanced ECommerce (EEC) reporting, to track bounce rate Let’s dive into six reports from Google Analytics that can improve your Shopify experience.
SEO Design Chicago offers custom GA 4 training options for companies of all sizes using Shopify sites.

How to determine which Shopify marketing efforts that drive the most sales
The Google Analytics acquisition report can quickly show you what marketing efforts are driving the most sales. The report tells you how users first end up at your Shopify store. Each acquisition channel includes metrics such as revenue, average order value, and conversion rate.
The Google Analytics acquisition report will help you identify the channels in which you should increase or decrease your marketing efforts.
Here’s a step-by-step guide to accessing the acquisition report in your Google Analytics account.
- Sign in to GA4 Account.
- Click Acquisition (located under Life Cycle in the left-hand column)
- Click User acquisition.
- Set Date Range.
- Set segment to First user…
Take note that the segmentation in step 5 depends on how you’ve set up your marketing campaigns. For example, the “First user medium” shows the medium that brought the user to your Shopify store in the first place.
How to learn which organic landing pages drive the most sales
A landing page is a standalone web page in a marketing or advertising campaign. It’s where a visitor “lands” after they click on a link in an email or an ad in a search engine. The goal of your landing page is a call to action. In other words, it encourages visitors to buy your product from your Shopify store.
The Google Analytics organic traffic landing page report lets you see which organic landing pages are bringing in the most traffic. Knowing this lets you improve your content marketing funnel.
Here’s a step-by-step guide to accessing the organic traffic landing page report in GA4.
- Sign in to GA4 Account.
- Click Engagement (located under Life Cycle in the left-hand column.)
- Click Pages and Screens.
- Add comparison: Create a dimension to include session medium: organic.
- Set Date Range.
- Change Page Title to Page path + query string and screen class.
- Change Event Count All Events to session_start.
- Filter by session_start by clicking on the Event Count header.
How to know which landing pages are most likely to increase sales
Your search engine optimization (SEO) success is measured, in part, by increased organic traffic to high-value pages by a certain percentage. Increasing relevant traffic to product pages with a high purchase-to-view rate has the greatest potential to increase sales.
The Google Analytics purchase-to-view rate report will show you the conversion rate from viewing product details to purchasing the product.
Here’s a step-by-step guide to accessing the purchase-to-view rate report in GA4.
- Sign in to GA4 Account.
- Click Monetization.
- Click Ecommerce purchases.
- Add comparison: Create a dimension to include session medium: organic.
- Set Date Range.
- Table is organized by item name.
- Click on the header, Purchase-to-view rate.
How to find where potential customers are dropping off
Sometimes potential customers will make it to the checkout page but leave without making a purchase.
The Google Analytics conversion funnel visualization report allows you to see where customers are exiting the Shopify checkout process and what’re they’re doing instead. The report also allows you to see trends over time, how long it takes users to complete each step, and what users who drop out of the funnel are doing.
Here’s a step-by-step guide to accessing the conversion funnel visualization report in GA4.
- Sign in to GA4 Account.
- Click Explore (located in the far left-hand column.)
- Select Funnel exploration, which displays a sample report.
- Remove Steps.
- Click Pencil Icon.
- Step 1: view_item.
- Step 2: add_to_cart.
- Step 3: purchase.

How to calculate Customer Lifetime Value accurately in Shopify
Customer lifetime value (CLV) is the total worth a customer has for a business over the entirety of their relationship. Keeping existing customers costs less than it does to acquire new customers, so increasing the value of your existing customers helps drive growth.
Understanding the average lifetime value of your customers helps you to set cost-per-action (CPA) and return-on-investment (ROI) goals for your Shopify business.
The Google Analytics lifetime value report will help you determine which marketing campaigns are performing best within your CPA and ROI goals.
Here’s a step-by-step guide to accessing the lifetime value report in GA4.
- Sign in to GA4 Account.
- Click Explore in the far left menu.
- Click Template Gallery.
- Select the User lifetime template.
How to define who is interested in your product
A custom user journey report shows you the users who are most interested in buying your products and how the marketing channels work together to move potential customers from their first encounter with your Shopify store to a finalized sale.
The Google Analytics custom user journey report allows you to visualize which sales channels are driving events at the top of your sales funnel and how those channels impact the events at the bottom of your sales funnel.
Here’s a step-by-step guide to accessing the custom user journey report in GA4.
- Sign in to GA4 Account.
- Click Custom Reports.
- Click Create New Report.
- Title Report: “Custom User Journey Report”
- Add a Report Tab.
- Name: Report Tab.
- Type: Flat Table
- Dimensions: Source/Medium
- Metrics: Sessions, Custom Metrics, Transactions, Ecommerce CVR, Buy-to-detail rate.

Using Google Analytics and Shopify
If you add Google Analytics tracking to gather this data, you will be able to make strategic marketing decisions easily and efficiently.
If you need more assistance integrating Google Analytics into your Shopify store, contact SEO Design Chicago today. Our team of experts can set up Google Analytics for you and create goals to ensure your marketing and website budgets are getting the best results.
FAQ
- What is Google Analytics?
- How can Google Analytics improve your Shopify store?
- What is Shopify?
- Why is a landing page important in marketing?
- How does Google Analytics help your ROI goals?
Contact Us Today!