


Local SEO Performance Across 10 Different Industries: A 6-Month Analysis
- 1 Local SEO Performance Across 10 Different Industries: A 6-Month Analysis
- 2 Cross-Industry Expertise That Delivers Results
- 3 Why Local SEO Matters More Than Ever in 2026
- 4 Methodology and Data Sources
- 5 Industry-by-Industry Performance Analysis
- 5.1 1. Healthcare (Medical Practices, Dentists, Specialists)
- 5.2 2. Legal Services
- 5.3 3. Restaurants & Food Service
- 5.4 4. E-commerce & Local Retail
- 5.5 5. Home Services (Plumbing, HVAC, Landscaping)
- 5.6 6. Real Estate
- 5.7 7. Automotive (Dealerships, Repair Shops)
- 5.8 8. Financial Services (Accountants, Advisors, Insurance)
- 5.9 9. Fitness & Wellness (Gyms, Spas, Studios)
- 5.10 10. Professional Services / B2B
- 6 Cross-Industry Insights and Universal Ranking Factors
- 7 Strategic Recommendations by Industry Type
- 8 Putting Data Into Action
- 9 Partner with SEO Design Chicago
An SEO Design Chicago Research Report
Cross-Industry Expertise That Delivers Results
At SEO Design Chicago, we’ve had the privilege of helping hundreds of businesses across diverse industries improve their local search visibility and drive meaningful conversions. From healthcare providers seeking new patients to restaurants filling tables during slow periods, from attorneys building their caseloads to fitness studios attracting new members, our team has developed deep expertise in what works—and what doesn’t—when it comes to local SEO optimization.
This breadth of experience provides us with a unique vantage point that few agencies can match. While many SEO providers specialize in a single vertical—becoming experts in healthcare marketing or restaurant promotion—our cross-industry portfolio allows us to identify patterns that transcend any one market. We’ve observed which ranking factors carry universal weight, which industries face the steepest competition for local visibility, and how businesses can optimize their presence regardless of what they sell or who they serve.
Perhaps most importantly, this cross-industry perspective reveals optimization opportunities that vertical specialists often miss. When we see a strategy succeeding for home services clients, we test whether it applies to legal services. When restaurants achieve breakthrough review velocity, we adapt those tactics for healthcare practices. This constant cross-pollination of ideas accelerates results for every client in our portfolio.
This report synthesizes six months of performance data from our client portfolio, offering actionable benchmarks for conversion rates, cost-per-lead metrics, and ranking factors across ten distinct industries. Whether you’re a marketing professional developing a strategy for clients or a business owner looking to understand how your local SEO performance stacks up against competitors, this analysis provides the data-driven insights you need to make informed decisions and allocate resources effectively.
Why Local SEO Matters More Than Ever in 2026
The numbers tell a compelling story about local search behavior and its business impact. According to recent research, 98% of consumers now search online for local businesses—up from 90% just five years ago. This isn’t a gradual shift; it’s a fundamental transformation in how people find and evaluate local providers. Even more striking, 80% of U.S. consumers conduct local searches on a weekly basis, with 32% searching daily. These aren’t casual browsers killing time—they’re active buyers with immediate intent.
The conversion power of local search is remarkable: 76% of people who search for something nearby visit a business within 24 hours, and 80% of local searches convert into customers. Compare this to other marketing channels where conversion rates hover in the low single digits, and the value of local search visibility becomes immediately apparent. When someone searches “plumber near me” or “Italian restaurant downtown,” they’re not conducting academic research—they’re ready to hire or dine.
The local SEO industry has grown to over $80 billion globally, reflecting both the opportunity and the competition businesses face in local search. With 46% of all Google searches carrying local intent—representing approximately 1.5 billion “near me” searches every month, or roughly 50 million local searches every single day—the stakes for local visibility have never been higher. Businesses that fail to invest in local SEO effectively cede these high-intent searches to competitors.
The rise of mobile search has only amplified local SEO’s importance. Mobile devices now account for over 60% of local search traffic, and mobile searchers demonstrate even higher intent and conversion rates than desktop users. Searches for “open now near me” have surged 400% in recent years, reflecting consumers’ expectation of immediate, relevant results. For a deeper dive into the statistics shaping local search behavior and business impact in 2025, we recommend reviewing our comprehensive Local SEO Statistics Guide, which provides additional context for the benchmarks discussed throughout this report.
Methodology and Data Sources
This analysis draws from six months of performance data (June 2024 through November 2024) across SEO Design Chicago’s client portfolio. We examined conversion rates, cost-per-lead metrics, and ranking factor correlations for businesses in ten industry categories. Our sample includes businesses ranging from single-location service providers to multi-location enterprises, spanning urban, suburban, and rural markets across the United States.
All data was normalized for market size and geographic competition to ensure meaningful cross-industry comparisons. A law firm in Manhattan faces different competitive dynamics than one in suburban Ohio; our normalization methodology accounts for these variations while preserving the integrity of industry-level insights.
Key metrics tracked include Google Business Profile performance (impressions, actions, direction requests, phone calls), local pack rankings for target keywords, organic local visibility in traditional search results, website conversion events directly attributable to local search traffic (form submissions, calls, appointment bookings), and customer acquisition costs broken down by organic and paid channels. Cost-per-lead calculations incorporate both paid local advertising investment and the allocated cost of organic SEO services to provide a complete picture of customer acquisition economics.
Industry-by-Industry Performance Analysis

The following sections provide detailed performance benchmarks for each of the ten industries in our analysis. For each vertical, we report average conversion rates from local search traffic, cost-per-lead benchmarks for both organic and paid acquisition, six-month performance trends, the top ranking factors driving visibility, and key insights that differentiate high performers from average competitors.
1. Healthcare (Medical Practices, Dentists, Specialists)
Average Conversion Rate: 3.2% from local search traffic
Average Cost-Per-Lead: $285 (organic) / $401 (paid)
6-Month Trend: +18% improvement in local pack visibility
Healthcare represents one of the most competitive and high-stakes local SEO environments we analyze. Patient acquisition costs remain elevated due to stringent advertising regulations, HIPAA compliance requirements, and the trust-intensive nature of healthcare decisions. Patients don’t choose providers lightly—they research extensively, read reviews carefully, and often ask for referrals before making appointments. Our healthcare marketing specialists have developed strategies specifically calibrated to navigate these challenges while maximizing patient acquisition.
Our data shows that practices with 100+ Google reviews consistently outperform competitors in local pack rankings, with review recency proving particularly impactful. Practices receiving at least two new reviews per week maintained 23% higher visibility than those with stagnant review profiles, regardless of total review count. Google’s algorithm increasingly favors businesses demonstrating ongoing patient satisfaction rather than those resting on historical review accumulation.
Top Ranking Factors: Primary Google Business Profile category accuracy, review quantity and recency, proximity to searcher, complete service listings with medical specialties clearly defined, and a HIPAA-compliant website with clear appointment booking functionality. Practices that offer online scheduling convert local searchers at 34% higher rates than those requiring phone calls.
Key Insight: Specialty practices (dermatology, orthopedics, cardiology) show 35% lower cost-per-lead than general practitioners due to reduced local competition and higher search intent specificity. Patients searching for specialists have typically already identified their need; patients searching for general practitioners face more provider options and longer decision cycles.
2. Legal Services
Average Conversion Rate: 2.8% from local search traffic
Average Cost-Per-Lead: $502 (organic) / $649 (paid)
6-Month Trend: +12% increase in qualified consultation requests
Legal services represent the highest cost-per-lead environment in local search, driven by intense competition for valuable cases and the high lifetime value of legal clients. A single personal injury, family law, or criminal defense client can generate $10,000 or more in revenue, with complex cases reaching six figures. This economics justify significant marketing investment and create fierce competition for visibility.
Interestingly, organic SEO converts legal clients at 3.4x the rate of PPC advertising—one of the highest differentials in any industry. Prospective clients view high organic rankings as a signal of industry leadership and trustworthiness, while paid ads carry an implicit “they paid to be here” association that undermines trust for high-stakes legal decisions. Law firms that achieve page-one organic rankings report significantly higher quality inquiries than those relying primarily on paid advertising.
Top Ranking Factors: Practice area-specific landing pages optimized for local search terms, individual attorney profile pages with credentials and bar admissions, review quality and sentiment (particularly reviews mentioning specific case outcomes or communication quality), local citation consistency across legal directories, and thought leadership content demonstrating expertise.
Key Insight: Practice area significantly impacts cost-per-lead. Personal injury and criminal defense face the highest costs (often exceeding $700 per lead) due to aggressive competition and high case values. Estate planning and business law practices often achieve qualified leads under $300 due to lower competition intensity and different searcher behavior.
3. Restaurants & Food Service
Average Conversion Rate: 8.4% from local search traffic
Average Cost-Per-Lead: $18 (organic) / $42 (paid)
6-Month Trend: +654% year-over-year increase in bookings from local search (industry-wide)
Restaurants enjoy the highest conversion rates and lowest cost-per-lead of any industry we analyzed. The immediate, transactional nature of dining decisions translates to rapid conversions from local search visibility—when someone searches “Thai food near me” at 6 PM, they’re not planning next month’s dinner; they’re deciding tonight’s meal. This urgency creates ideal conditions for local SEO success. Our restaurant digital marketing team has helped dozens of establishments capitalize on this high-intent search behavior.
Research shows 93% of diners check online menus before visiting a restaurant, making Google Business Profile menu optimization absolutely critical. Recent reviews (less than two weeks old) carry the highest influence on restaurant visibility in our analysis. Google’s algorithm recognizes that dining preferences are highly time-sensitive—a rave review from six months ago matters less than a mediocre review from yesterday.
Top Ranking Factors: Menu items and highlights matching search queries (“best pad thai downtown” should find restaurants with “pad thai” in their menu listings), review recency and volume, high-quality food photography, accurate hours and holiday schedules, and reservation or ordering integration. Restaurants with online ordering enabled see 28% higher engagement from local search.
Key Insight: Restaurants in our portfolio that updated their GBP with weekly posts and responded to 100% of reviews within 24 hours saw 41% higher visibility than competitors who updated monthly or less frequently. The restaurant industry rewards active, engaged profile management more than any other vertical we track.
4. E-commerce & Local Retail
Average Conversion Rate: 4.1% from local search traffic
Average Cost-Per-Lead: $34 (organic) / $91 (paid)
6-Month Trend: +28% increase in “near me” driven foot traffic
Local retail occupies a unique position in the search landscape, bridging online research and offline purchasing behavior. The rise of “research online, buy offline” (ROBO) shopping has made local SEO critical for retailers who previously relied on foot traffic and window displays. Our data shows 53% of shoppers cite accurate store hours as their top priority when searching for local retailers—outdated business information directly correlates with lost sales and frustrated customers.
The “open now near me” search query has surged 400% in recent years, emphasizing the importance of real-time accuracy in retail local SEO. Retailers must maintain current hours not just for regular operations but for holiday schedules, special events, and unexpected closures. A single instance of showing “open” when actually closed can generate negative reviews that persist for months.
Top Ranking Factors: Product inventory integration with Google Business Profile, accurate store hours across all platforms (Google, Apple Maps, Yelp, and your website must match exactly), in-store pickup availability signals, local inventory ads, and review volume emphasizing product availability and customer service.
Key Insight: Retailers utilizing Google’s local inventory features and product feeds see 67% higher click-through rates than those relying solely on standard GBP listings. Showing searchers that you have the specific product they want in stock, available for pickup today, transforms local search from awareness into immediate action.
5. Home Services (Plumbing, HVAC, Landscaping)
Average Conversion Rate: 5.7% from local search traffic
Average Cost-Per-Lead: $86 (organic) / $142 (paid)
6-Month Trend: +34% improvement in emergency service visibility
Home services present a bifurcated local SEO challenge that requires different strategies for different service types. Emergency services (burst pipe, AC failure in August, furnace breakdown in January) require immediate visibility and often bypass traditional evaluation—when water is flooding your basement, you’re not comparing five plumbers; you’re calling the first one who can come now. Our plumber marketing services and HVAC marketing programs are specifically designed to capture these high-value emergency searches while also building visibility for planned maintenance and installation services.
Our analysis shows emergency-focused keywords convert at 2.3x the rate of planned service terms, though competition for emergency visibility remains fierce and expensive. Home service providers optimizing for “emergency” and “24 hour” terms face higher CPCs but generate leads with dramatically higher close rates and typically premium pricing acceptance.
Top Ranking Factors: Service area accuracy and configuration, 24/7 availability indicators prominently displayed, response time mentioned in reviews (“arrived within 30 minutes” reviews carry significant weight), licensing and insurance badges, and before/after photo galleries showcasing completed work.
Key Insight: Home service businesses that respond to review inquiries within one hour see 47% higher conversion rates from local search than those responding within 24 hours. Speed signals reliability—if you respond quickly to reviews, customers assume you’ll respond quickly to service calls.
6. Real Estate
Average Conversion Rate: 1.9% from local search traffic
Average Cost-Per-Lead: $341 (organic) / $448 (paid)
6-Month Trend: +22% increase in neighborhood-specific search visibility
Real estate presents longer sales cycles that compress apparent conversion rates, though the lifetime value of a client (often spanning multiple transactions, referrals, and decade-long relationships) justifies elevated acquisition costs. A single buyer client can generate $10,000+ in commission, with seller listings often worth even more. This value equation supports substantial local SEO investment.
SEO converts real estate clients at 3.5x the rate of PPC, reflecting the trust-intensive nature of property decisions. Home buyers and sellers research extensively before committing to an agent relationship; organic search visibility signals market expertise and established credibility in ways that paid advertising cannot replicate. Individual agents and brokerages show markedly different performance patterns in our data, with top-performing agents dramatically outpacing brokerage-level listings.
Top Ranking Factors: Hyperlocal neighborhood content demonstrating area expertise, individual agent profile optimization (not just brokerage listings), transaction history signals, review recency and detail (especially reviews mentioning specific neighborhoods or property types), and IDX integration with local market data showing active listings and recent sales.
Key Insight: Agents with dedicated neighborhood landing pages covering schools, amenities, market trends, and local insights outperform those with generic service pages by 156% in local organic rankings. Hyperlocal expertise is the defining competitive advantage in real estate local SEO.
7. Automotive (Dealerships, Repair Shops)
Average Conversion Rate: 3.8% from local search traffic
Average Cost-Per-Lead: $178 (organic) / $283 (paid)
6-Month Trend: +19% improvement in service department visibility
Automotive local SEO requires distinct strategies for sales and service operations, which often function as separate businesses despite sharing a roof. Dealership sales searches carry high intent but face intense OEM competition (manufacturer websites and programs) and third-party aggregator competition (AutoTrader, Cars.com, CarGurus). Service department searches offer more accessible ranking opportunities with less aggregator interference. Our automotive marketing experts understand these dynamics and develop strategies that maximize visibility across both sales and service operations.
Our data shows independent repair shops achieve 45% lower cost-per-lead than franchise dealerships for service appointments. Independent shops face less brand-mandated marketing overhead and can optimize more aggressively for local search terms without corporate approval processes slowing implementation.
Top Ranking Factors: Vehicle make and model service specificity (ranking for “Honda brake repair” rather than generic “brake repair”), transparent pricing signals where applicable, certification and warranty badges (ASE certification, manufacturer authorization), detailed service descriptions, and appointment scheduling integration.
Key Insight: Repair shops listing specific services by make and model (“BMW brake repair,” “Honda transmission service,” “Ford diesel specialist”) rather than generic offerings see 89% higher click-through rates from local search. Specificity signals expertise and helps searchers self-qualify before clicking.
8. Financial Services (Accountants, Advisors, Insurance)
Average Conversion Rate: 2.4% from local search traffic
Average Cost-Per-Lead: $487 (organic) / $653 (paid)
6-Month Trend: +15% increase in qualified consultation requests
Financial services face the second-highest cost-per-lead after legal, driven by compliance requirements that limit advertising options, intense competition for affluent clients, and high customer lifetime values that justify substantial acquisition investment. A financial advisory relationship can span decades and generate significant ongoing revenue, making client acquisition a worthwhile investment even at premium CPLs.
SEO converts financial services clients at a remarkable 7.3x the rate of PPC advertising—the highest differential of any industry we studied. This dramatic gap reflects the extreme trust sensitivity of financial decisions; organic rankings signal credibility and industry standing in ways that paid advertising simply cannot replicate. When someone is choosing who to trust with their retirement savings or business finances, “sponsored” results carry inherent skepticism.
Top Ranking Factors: Credential and certification visibility (CPA, CFP, CLU designations), thought leadership content demonstrating expertise, review sentiment emphasizing trustworthiness and communication quality, regulatory compliance signals, and detailed service descriptions that help searchers understand offerings.
Key Insight: Financial professionals investing in educational content marketing achieve 58% lower cost-per-lead than those relying primarily on advertising. Content establishes the trust signals essential to this vertical—blog posts explaining tax strategies, retirement planning guides, and market commentary position advisors as trusted experts rather than salespeople.
9. Fitness & Wellness (Gyms, Spas, Studios)
Average Conversion Rate: 6.2% from local search traffic
Average Cost-Per-Lead: $45 (organic) / $78 (paid)
6-Month Trend: +31% improvement in trial membership conversions
Fitness and wellness businesses benefit from strong location-based search intent—research shows 50% of gym members cite location as their primary retention factor. This proximity dependency makes local SEO particularly impactful for this vertical; the gym that ranks when someone searches “gyms near me” has a significant advantage over competitors that require a longer commute. Convenience often trumps price and amenities in fitness decisions.
Businesses in the fitness and wellness space with high-quality photos and complete business descriptions are 40% more likely to appear in the Google Map Pack according to recent research. Visual content matters enormously for fitness—potential members want to see the equipment, the space, and the atmosphere before committing to a visit. Virtual tours and video content further improve engagement.
Top Ranking Factors: Class schedule integration showing real-time availability, comprehensive amenity listings, virtual tour availability, trainer and instructor profiles with credentials, and trial offer visibility in search results. Membership type clarity (24-hour access, family plans, student discounts) helps searchers self-qualify.
Key Insight: Fitness businesses offering prominently displayed trial memberships or class passes in their GBP convert local searchers at 73% higher rates than those requiring immediate commitment. Reducing friction to first visit dramatically improves conversion from search to member.
10. Professional Services / B2B
Average Conversion Rate: 1.7% from local search traffic
Average Cost-Per-Lead: $312 (organic) / $497 (paid)
6-Month Trend: +14% increase in qualified B2B inquiry volume
B2B professional services face the longest sales cycles in local search, which compresses apparent conversion rates but delivers high-value relationships worth substantial investment. Local intent in B2B often centers on partnership, vendor relationships, or professional services rather than immediate transactions—a business searching for “IT consultants near me” is beginning a evaluation process, not making an impulse purchase.
Our data shows B2B companies that invest in thought leadership SEO see cost-per-lead drop from $312 to $164—a 47% reduction. This dramatic improvement reflects how content marketing addresses the extended consideration cycles characteristic of B2B purchasing. Businesses research extensively before engaging vendors; companies that provide valuable information during this research phase establish trust before the first sales conversation.
Top Ranking Factors: Industry-specific service pages optimized for B2B search terms, case study content with measurable outcomes, client testimonials with company attribution (not anonymous), professional certifications and partnership badges, and LinkedIn integration demonstrating professional network.
Key Insight: B2B service providers with detailed case studies indexed for local search terms achieve 124% higher engagement rates than those with generic service descriptions. Specific examples of work performed for real clients (with permission) demonstrate capabilities far more effectively than service lists alone.
Cross-Industry Insights and Universal Ranking Factors

Conversion Rate Analysis Across Verticals
Our six-month analysis reveals significant variance in local search conversion rates across industries, reflecting fundamental differences in purchase behavior rather than optimization quality. Restaurants lead at 8.4%, benefiting from immediate transactional intent and low purchase friction. Fitness and wellness (6.2%) and home services (5.7%) follow, both serving urgent or location-dependent needs where proximity drives quick decisions.
At the lower end, professional B2B services (1.7%) and real estate (1.9%) reflect longer consideration cycles rather than optimization deficiencies. These industries involve higher-stakes decisions, multiple stakeholders, and extended evaluation periods that naturally compress measured conversion rates even when campaigns perform optimally.
The key insight: conversion rate benchmarks must account for purchase cycle length and customer lifetime value. A 1.7% conversion rate in B2B—where sales cycles span months and deal values reach six figures—often delivers superior ROI compared to an 8% rate in quick-service dining. Raw conversion percentages without revenue context can mislead strategic decisions.
Cost-Per-Lead Analysis
Cost-per-lead varies by nearly 40x across industries, from $18 for organic restaurant leads to over $650 for paid legal and financial services acquisition. This variance directly correlates with customer lifetime value and competitive intensity rather than marketing efficiency. High-CPL industries (legal, financial, healthcare) typically justify these costs through substantial client revenue; a law firm generating $15,000 from a single client can absorb a $500 acquisition cost while maintaining healthy margins.
Across all industries, organic local SEO delivers leads at 35-55% lower cost than paid advertising, with the gap widening in trust-sensitive verticals. Financial services shows the most dramatic differential—organic leads cost 25% less than paid while converting at 7.3x the rate. This combination makes organic SEO investment particularly attractive for trust-intensive services where credibility signals matter as much as visibility.
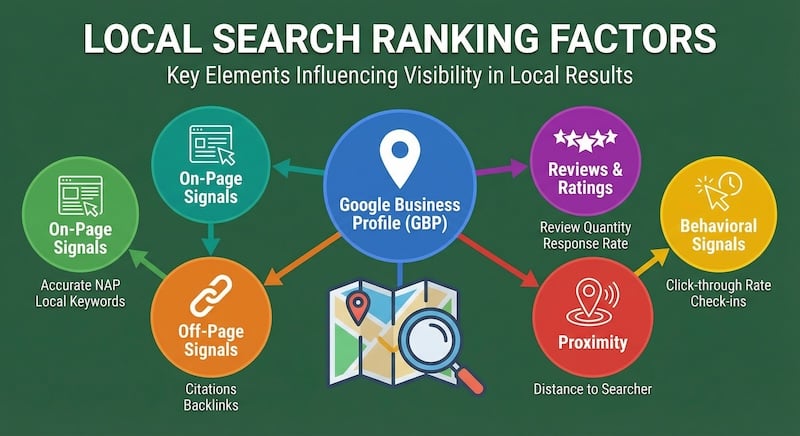
Universal Ranking Factors That Apply Across All Industries
Despite industry-specific variations, our analysis confirms several ranking factors that drive results across all verticals without exception:
- Primary GBP Category Selection: Choosing the wrong primary category remains the single most damaging local SEO mistake across every industry. Expert surveys consistently rank incorrect category selection as the top negative ranking factor. Getting this single field right matters more than dozens of other optimizations combined.
- Review Velocity and Recency: Businesses receiving consistent new reviews outperform those with stagnant profiles, regardless of total review count. Google’s algorithm increasingly favors fresh signals of customer satisfaction. Aim for regular, steady review acquisition rather than sporadic bursts followed by months of silence.
- Review Response Rate and Speed: In the Southern and Western U.S., businesses that don’t respond to reviews are 30% more likely to drop in local rankings compared to responsive competitors. Response signals active management and customer care. Fast response matters as much as any response—businesses responding within 24 hours outperform weekly responders.
- Service and Product Detail Depth: Detailed service listings matching specific search queries improve visibility across all industries. Generic descriptions underperform specific, searchable offerings. “Emergency plumbing repair” outranks “plumbing services” for emergency searches; “BMW brake service” outranks “auto repair” for BMW owners.
- NAP Consistency: Name, address, and phone number consistency across directories remains foundational, though its relative importance has declined as Google’s entity recognition has improved. Inconsistencies still confuse the algorithm and frustrate customers; consistency remains table stakes for local SEO success.
- Mobile Experience Quality: With mobile searches comprising over 60% of local queries, mobile-responsive websites with fast load times significantly impact conversion rates post-click. Businesses can rank well in local search but lose leads to poor mobile experiences. Technical optimization matters as much as visibility optimization.
Strategic Recommendations by Industry Type
High-Competition Industries (Legal, Healthcare, Financial)
Invest heavily in organic SEO for sustainable cost advantages; the trust differential between organic and paid visibility is highest in these verticals. Develop thought leadership content that establishes expertise and credibility. Focus on specialty or niche positioning to reduce direct competition. Prioritize review quality and sentiment over raw quantity—detailed reviews mentioning specific experiences carry more weight than generic positive ratings.
Service-Area Businesses (Home Services, Automotive)
Ensure service area configurations accurately reflect your actual coverage zones. Optimize aggressively for emergency and immediate-need keywords where conversion rates peak. Emphasize response time and availability in reviews and messaging—speed signals reliability. Maintain meticulous NAP consistency across service areas, especially for multi-location operations.
Foot-Traffic Dependent (Restaurants, Retail, Fitness)
Prioritize GBP completeness with photos, menus, and absolutely accurate current hours. Maintain aggressive review velocity—weekly new reviews minimum for competitive markets. Update posts and offers frequently to signal active management and give searchers reasons to choose you today. Integrate booking, scheduling, and ordering where applicable to reduce friction from search to action.
Trust-Intensive Verticals (Financial, Legal, Healthcare)
Leverage the dramatic organic-over-paid advantage these industries demonstrate. Showcase credentials, certifications, and professional affiliations prominently—these trust signals matter more here than in any other vertical. Encourage detailed reviews that mention specific outcomes or experiences. Invest substantially in educational content that positions you as an authority rather than a vendor.
Putting Data Into Action
Local SEO in 2026 demands both universal fundamentals and industry-specific expertise. The businesses winning local search understand that a one-size-fits-all approach simply doesn’t work—your strategy must be calibrated to your industry’s competitive dynamics, customer decision cycles, and trust requirements. A tactic that works beautifully for restaurants may fail completely for law firms; an approach that drives results in financial services may be overkill for retail.
Our cross-industry analysis reveals several consistent truths that apply regardless of vertical: organic SEO outperforms paid advertising in both cost efficiency and conversion rate, review management has become table stakes rather than differentiator, and the businesses investing in comprehensive GBP optimization consistently outrank those relying on partial efforts. The fundamentals matter; skipping steps costs visibility.
The 75% of local businesses who report that local SEO brings more qualified leads than paid advertising aren’t just lucky—they’re benefiting from strategic, sustained investment in their local search presence. They understand that local SEO isn’t a one-time project but an ongoing discipline that rewards consistent attention and continuous optimization.
Partner with SEO Design Chicago
Whether you’re a business owner looking to dominate local search in your market or a marketing professional seeking an experienced partner with cross-industry expertise, SEO Design Chicago has the proven track record to deliver results. Our team doesn’t just understand local SEO in theory—we’ve implemented successful campaigns across every industry analyzed in this report, developing practical expertise that accelerates results.
Our cross-industry experience provides an advantage that vertical specialists simply cannot match. We understand that a dental practice requires different strategies than a law firm, that a restaurant’s local SEO needs differ fundamentally from an HVAC company’s, and that success requires calibrating tactics to your specific competitive landscape. This breadth of experience means we avoid the tunnel vision that traps agencies working in single verticals.
With hundreds of successful local SEO campaigns across every industry analyzed in this report, we’ve developed proprietary frameworks that accelerate results while avoiding the costly trial-and-error that burns through budgets and delays success. Our local SEO services combine technical optimization, content strategy, review management, and ongoing performance monitoring into a comprehensive approach that drives measurable business growth from day one.
Ready to improve your local search performance? Contact SEO Design Chicago today for a complimentary local SEO audit. We’ll analyze your current visibility, benchmark your performance against the industry standards detailed in this report, and develop a customized strategy to help you capture more customers in your local market.
The businesses succeeding in local search aren’t waiting for perfect conditions or optimal timing—they’re investing in proven strategies with experienced partners who understand their industries. Let SEO Design Chicago put our cross-industry expertise to work for your business.
Contact Us today!